
Your 60/40 portfolio and the danger zone
Investing is not simple and the 60/40 portfolio is certainly not magic
There is a lot of talk lately regarding the 60/40 portfolio due to its simplicity and performance (2020 included). It surely gives good argumentation to the passive management camp and makes investing look simple.
Unfortunately investing is not simple, the 60/40 portfolio is not magic and in the current environment it may prove to be a significant source of risk for the market participants.
In this post we explore its historical performance, understand the drivers of its performance and highlight the risks of such a portfolio in the current environment.
Making money the easy way, right?
So the recipe is simple, we construct a portfolio that has 60% of US equities (as measured from S&P500) and 40% of 10Y treasury bonds and re-balance every month. Starting in 1928 with $1 investment we would have made by now around $100, in nominal terms. Adjusting for inflation is still a sizable return made with little or no effort.
Easy!

But where does performance come from?
Performance comes from both equities and treasury bonds. Actually, bonds have given better performance and risk adjusted returns.

source: FRED, KM Cube Analytics
Source: FRED
Bonds will protect my equity exposure in crisis periods, right?
Well, actually no… as can be seen from the table and correlation graph below, it is debatable whether bonds provide protection on equities’ downturns. This is rather a behavior observed in the last twenty years but not before.
| 10Y US Treasury yields (7 biggest S&P 500 sell-offs in history) |
|||||
|---|---|---|---|---|---|
| Peak | Trough | S&P500 drop % | US Treasury at Peak | US Treasury at Trough | Move in yields |
| 1929-09 | 1932-06 | -0.8978 | 3.700 | 3.760 | 0.06 |
| 1968-12 | 1970-06 | -0.3438 | 6.160 | 7.680 | 1.52 |
| 1973-01 | 1974-09 | -0.4783 | 6.520 | 7.940 | 1.42 |
| 1980-12 | 1982-07 | -0.2478 | 12.410 | 13.660 | 1.25 |
| 1987-09 | 1987-11 | -0.3296 | 9.590 | 9.030 | -0.56 |
| 2000-09 | 2009-02 | -0.5688 | 5.790 | 3.020 | -2.77 |
| 2020-01 | 2020-03 | -0.2103 | 1.519 | 0.699 | -0.82 |

source: KM Cube Analytics
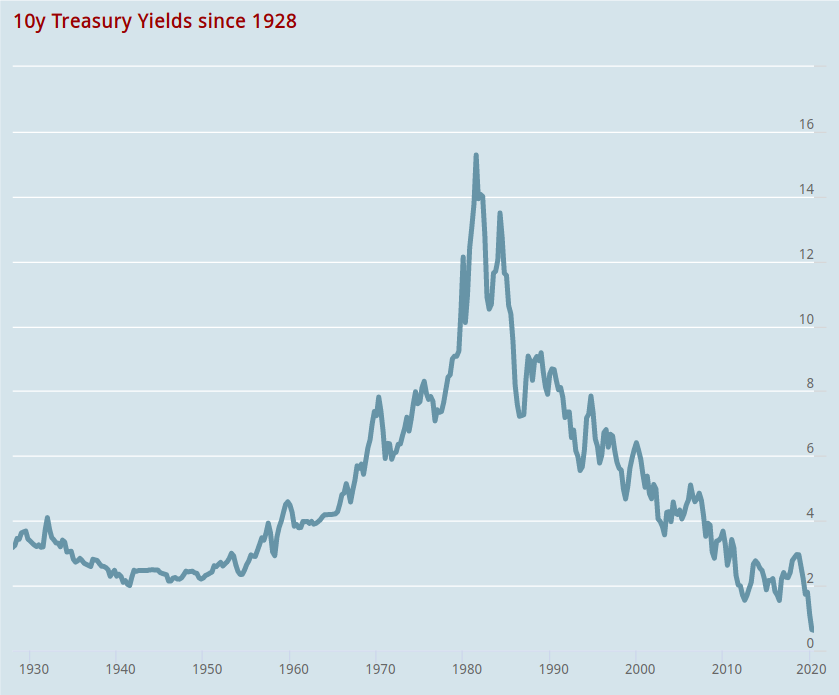
Where is the danger?
The 60/40 portfolio will face significant challenges in the foreseeable future:
- Ultra low yields: As yields are approaching zero, bonds will fail to protect a portfolio at current levels as low yields have little room for maneuver. Even if we assume that correlations will behave as they did in the last twenty years, it is difficult to see a drop of 200bps or 300bps to offset a substantial drop in equities.
- Inflation threat: An inflation threat may push yields higher (bonds lower) which in effect increases the risks imposed by the portfolio rather than providing protection at stress periods
- Overstretched valuations are posing a threat in portfolio returns even if we enjoy ample liquidity and support from the central banks.
Alternatives
In KM cube we have been using variations of the 60/40 for some time now in our systematic models. Since last year we have substituted the bond exposure with precious metals (particularly Gold) in an effort to mitigate the risks described above. This is not without risk. Our back-testing shows that such a portfolio increases portfolio variability along with risk.
However, because something worked in the past does not mean it will work in the future unless we understand the drivers of such behavior and we have the tools to evaluate and monitor its performance.
Does your portfolio resembles the 60/40 ? Do you own bonds in the hope that will protect you in the next downturn?
Be mindful of the dangers!